
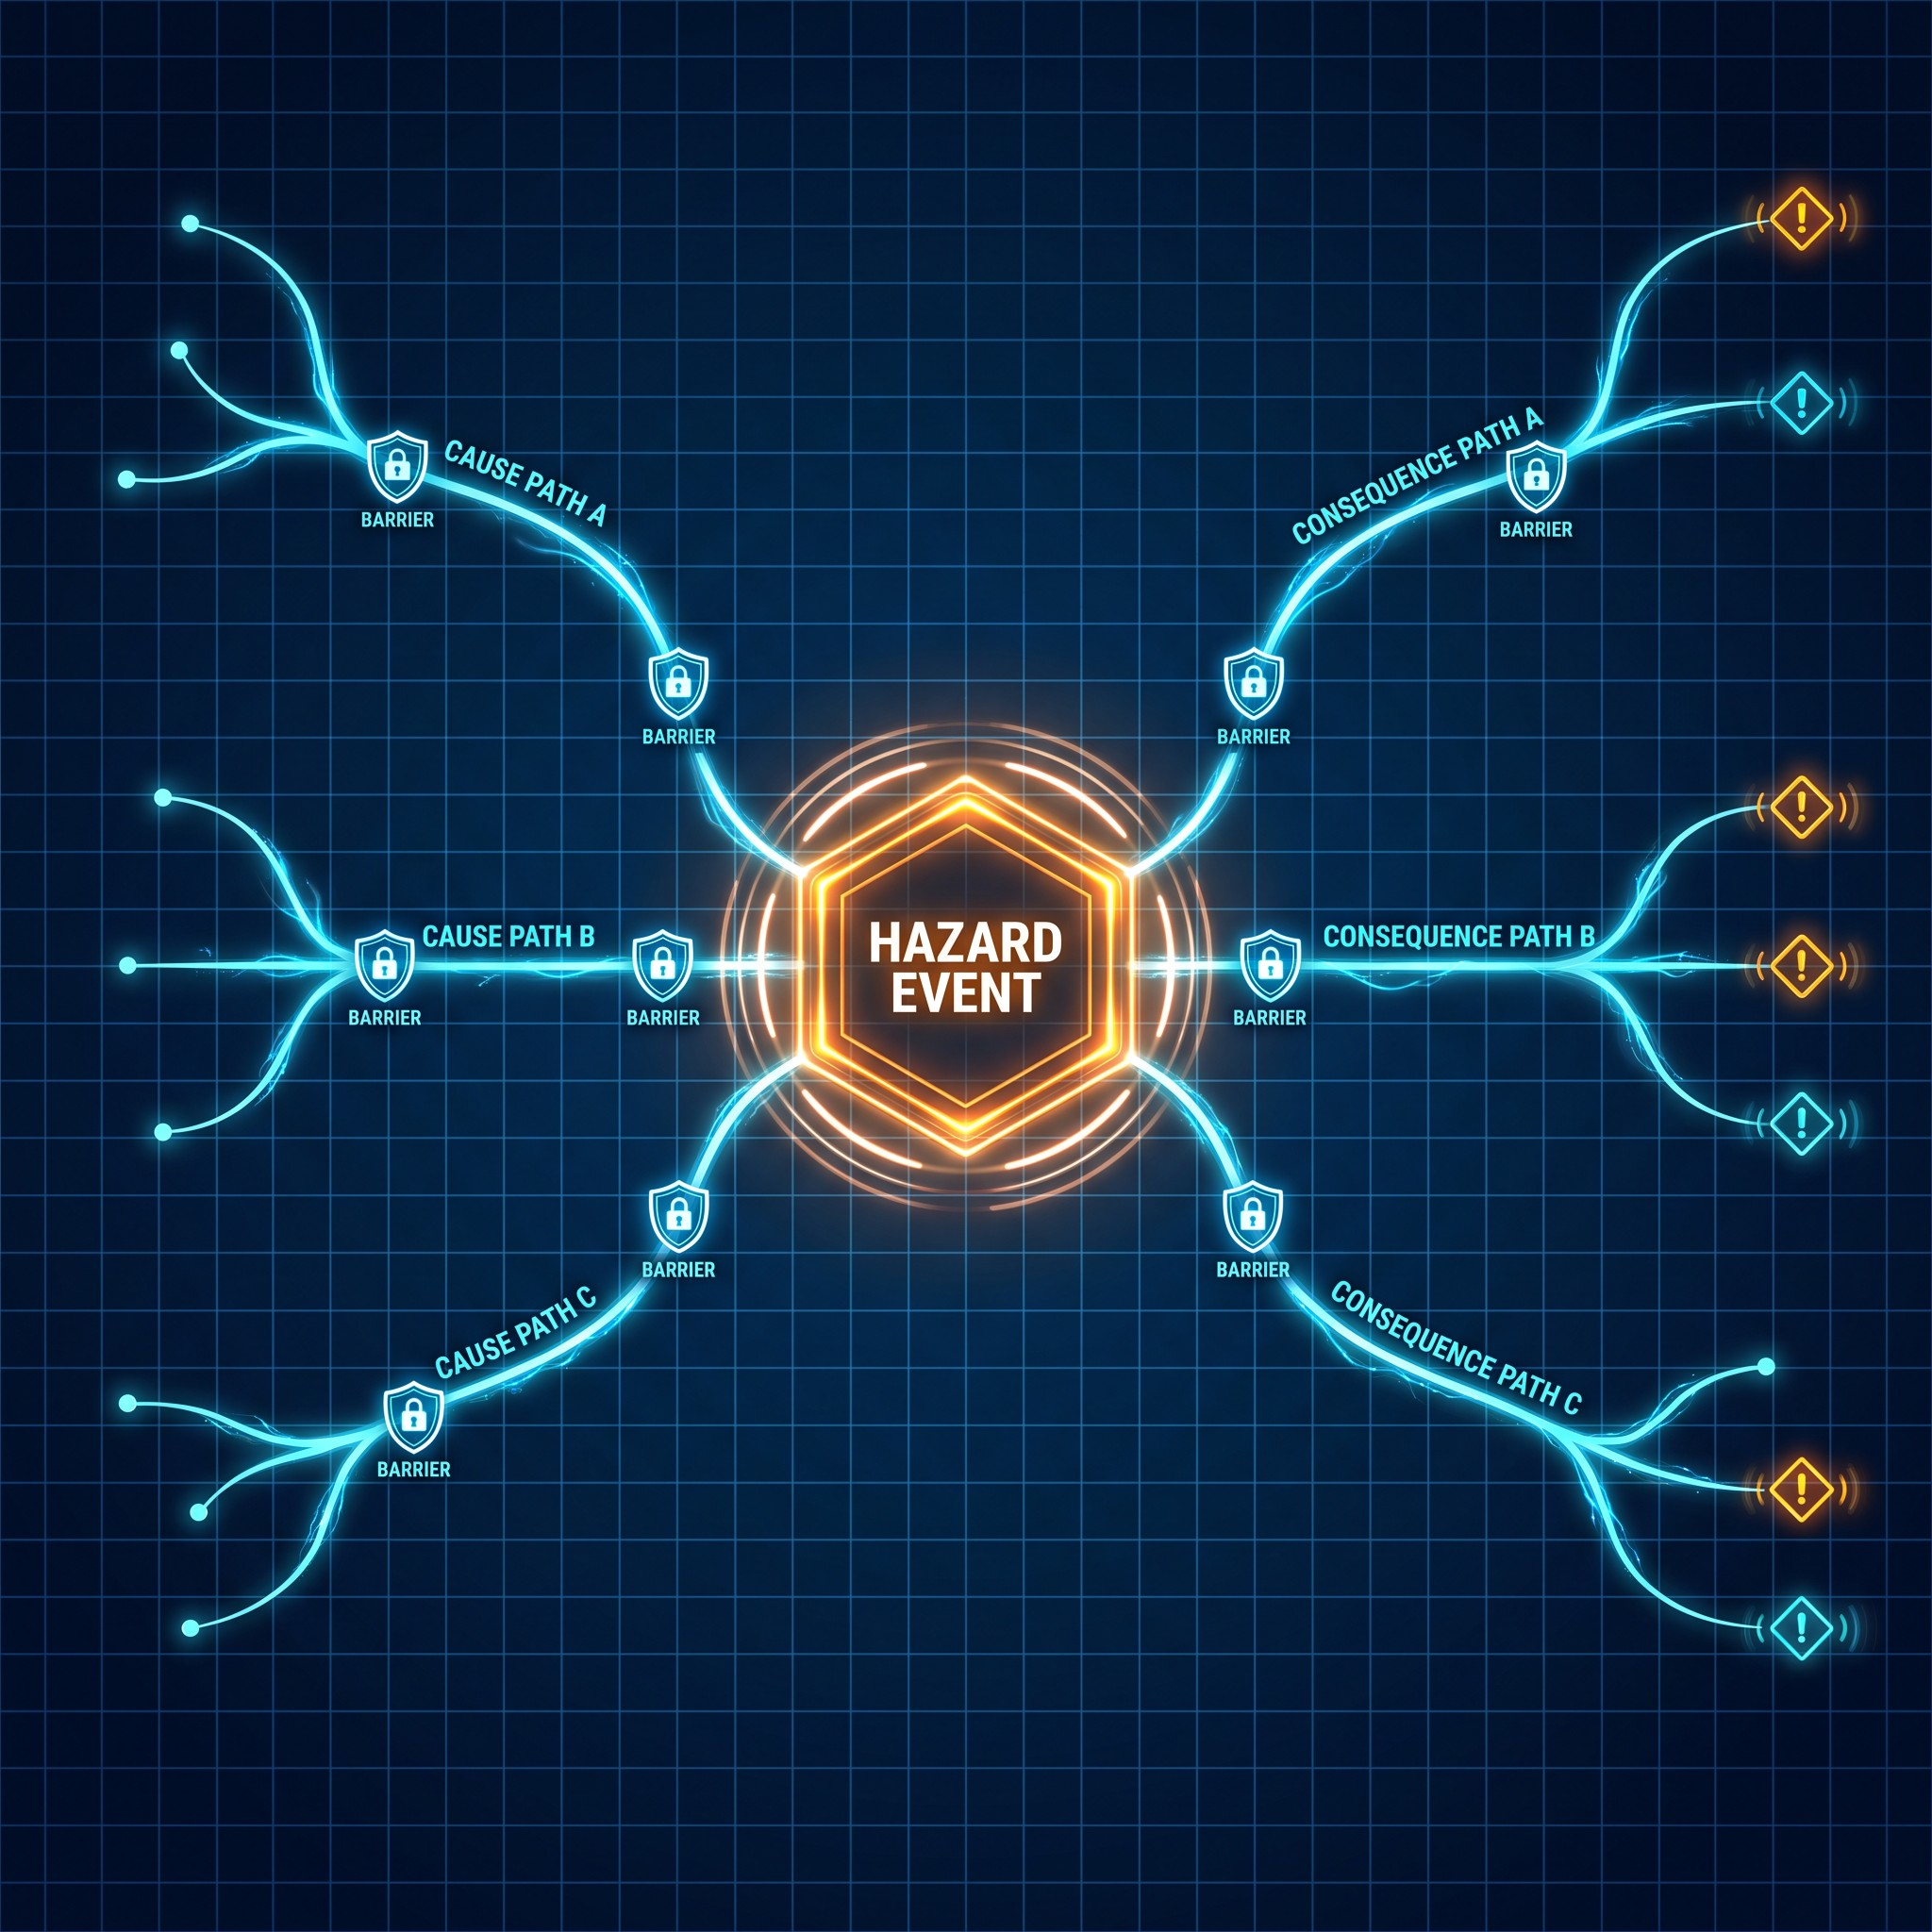
Major accidents rarely come from a single failure. When several small failures line up, like the holes in slices of Swiss cheese, a serious incident occurs. Bow Tie Analysis replaces pages of complex text with an auditable visual map that operators and executives can both understand.
What is Bow Tie Analysis?
Bow Tie Analysis is a visual risk modelling method. At the centre sits the Top Event, the exact moment control over a hazard is lost. Linear pathways run backward to its root causes (threats) on the left and forward to its consequences on the right, with barriers drawn onto each pathway.
The three defensive zones
- Preventative controls (left side). Safeguards that stop a root cause from triggering the Top Event. These are usually the most efficient and cost-effective barriers.
- Detective controls (centre). Technical sensors that catch the early symptoms, pressure spikes or warning signs of a hazard already developing.
- Mitigative controls (right side). Reactive barriers that activate after the Top Event to limit severity and speed up recovery.
Where a completed Bow Tie is used
A completed Bow Tie becomes the centrepiece of the facility’s safety system and connects several critical activities:
- Root Cause Analysis (RCA). Tracing an actual failure step by step through the diagram to pinpoint exactly which barrier failed.
- Scenario validation. Replacing speculation with credible, data-driven worst-case scenarios.
- Barrier health tracking. Linking Key Risk Indicators (KRIs) to barriers to monitor safeguard degradation in real time.
- Permit-to-Work (PTW) integration. Showing field operators why a safety rule exists by illustrating what is at stake downstream.
How EnTech can help
Our services include structured Bow Tie workshop facilitation and engineering mapping, direct integration with facility hazard registers and Safety Cases, critical barrier evaluation and KRI placement, and root cause analysis for process safety incident investigation. Contact us at info@EnTech-Solution.com.