
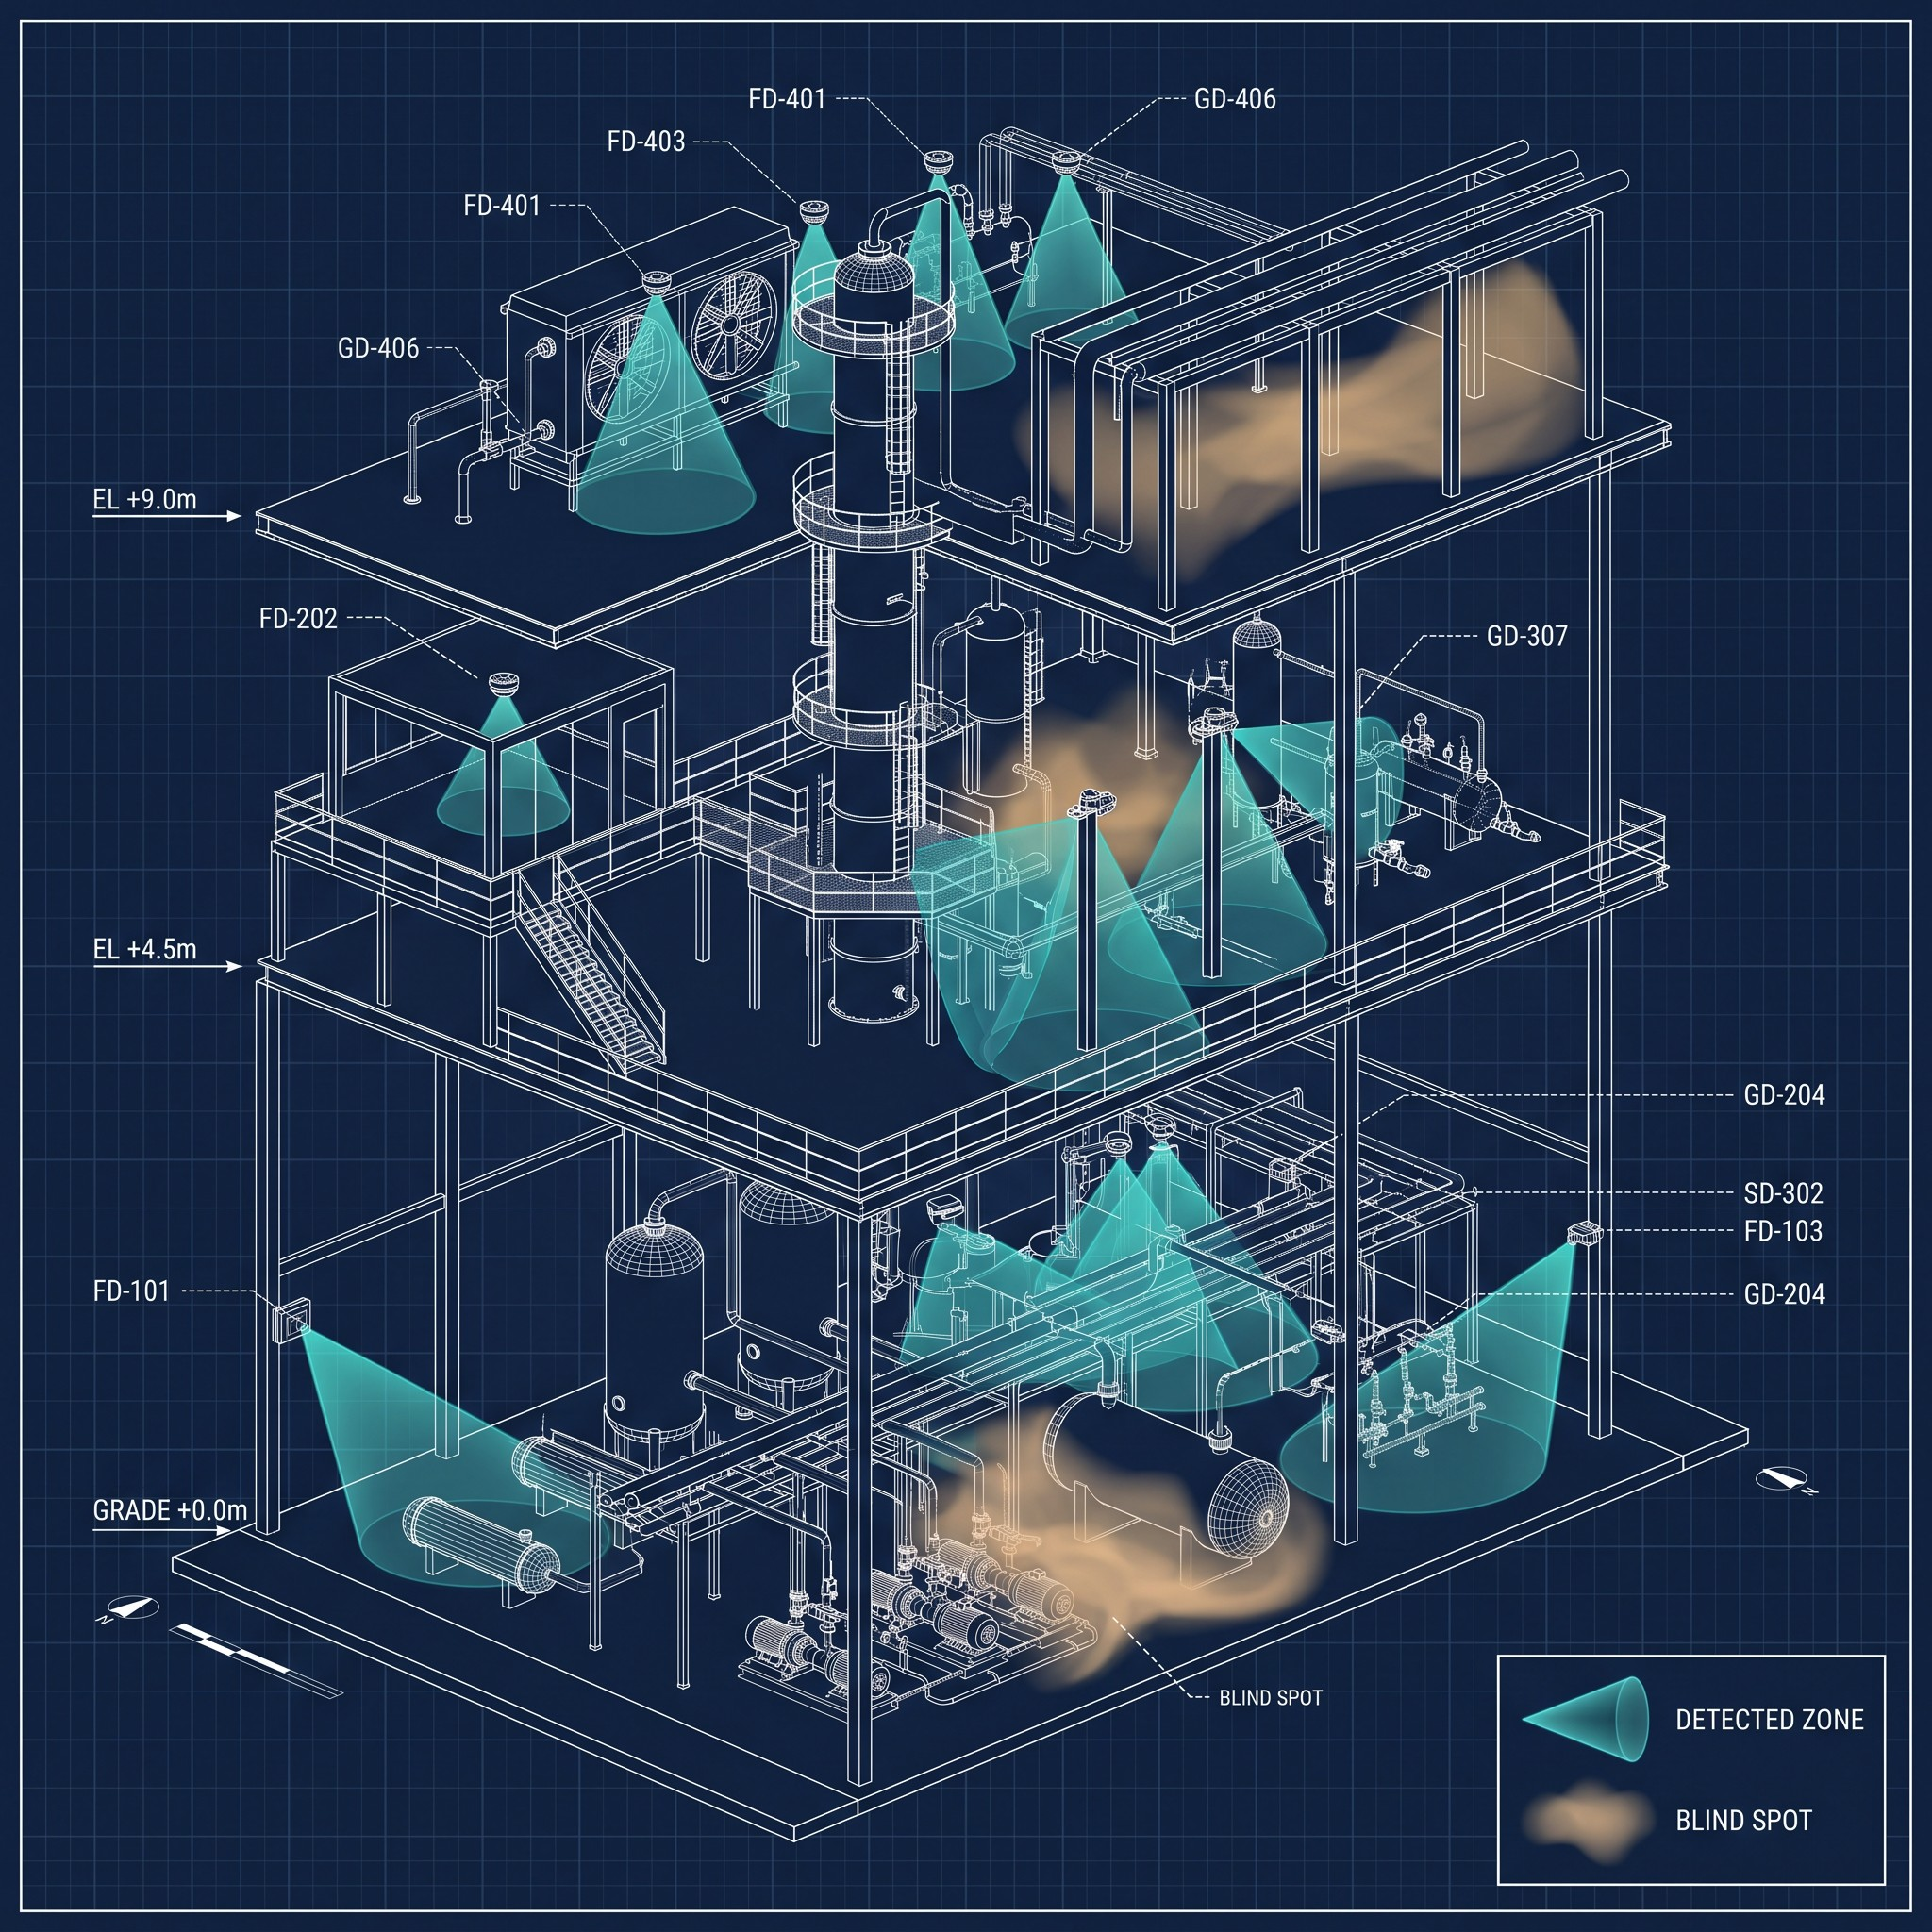
In high-risk industrial facilities, effective Fire and Gas (F&G) detection is not only about installing detectors. It is about ensuring complete and reliable coverage where hazards can actually occur. Designing an effective Fire and Gas System (FGS) needs accurate detector coverage calculations, and that is where F&G mapping plays a critical role.
What is F&G mapping?
Fire and Gas mapping is an engineering study used to evaluate and optimise the placement of flame, gas, smoke and heat detectors in an industrial facility. The aim is maximum detection coverage, with minimum blind spots and no unnecessary detector installations.
Two approaches
2D F&G mapping
A conventional approach based on plan-view layouts and detector coverage zones. It suits simple facilities and early-stage projects, but it is limited in how well it represents real plant geometry and vertical obstructions.
3D F&G mapping
An advanced, simulation-based method that uses full 3D facility models to evaluate detector line of sight and real coverage. Because it accounts for structures, piping, platforms and equipment congestion, it gives far more accurate and reliable results.
The technical weaknesses of 2D mapping
- Area versus volume. 2D mapping measures coverage by area, not volume, which restricts the analysis to flat plan-view contours.
- Height dependency and subjectivity. Coverage statistics change drastically with elevation. Picking one height is subjective and can compromise compliance, because real fires cut through several elevations.
- Target misalignment. A 2D contour can show zero visibility for a pool or jet fire when a true spatial evaluation shows it is clearly visible.
The advantages of 3D mapping
- Volume-based statistics. True volumetric coverage is calculated by comparing iso-volumes with the total volume of each fire zone.
- Objective compliance. One dataset per fire zone removes the subjective choice of height, so compliance rests on physical detector positions and CAD geometry.
- Accurate scenario emulation. Realistic fire targets, such as cones and cylinders representing jet and pool fires, can be placed to verify exact line of sight around obstructions.
- Optimised detector placement. Over-design is avoided while compliance and performance are assured.
- Regulatory alignment. It supports international standards and performance-based design requirements such as ISA TR84.00.07.
Because facilities, releases and detectors all exist in three dimensions, 3D mapping is the technically defensible way to verify a facility’s fire and gas detection layers.
Study outputs
- Gas detector coverage analysis.
- Flame detector line-of-sight evaluation.
- Coverage contour visualisation.
- Detector optimisation recommendations.
- Identification of blind and vulnerable areas.
- Risk-based detector placement strategies.
How EnTech can help
For Fire and Gas mapping and technical safety support, contact us at info@EnTech-Solution.com.