In oil and gas, petrochemical, chemical, power and pipeline facilities, major accidents can cause severe harm to people, assets and the environment. Qualitative tools such as HAZOP and HAZID are excellent at finding hazards, but they cannot tell you how likely a major accident is or how many people it could affect. That is the role of Quantitative Risk Assessment (QRA).
What is QRA?
QRA is a systematic, data-driven method for identifying, analysing and quantifying risk in hazardous facilities. It evaluates three things together: the likelihood of accident scenarios, the consequences to people, assets and the environment, and whether the resulting risk is acceptable against regulatory and company criteria. A true QRA moves beyond subjective opinion and gives clear, numerical insight into the survivability of both structures and people.
Consequence-only design versus risk-based design
A common misconception is that a facility should simply be designed for the worst-case scenario. A consequence-only approach looks only at the maximum credible impact and ignores how likely it is. The result is often an over-engineered layout and excessive capital expenditure, because the worst case rarely dominates a plant’s day-to-day risk profile.
A risk-based QRA combines frequency with consequence. It evaluates the full spectrum of scenarios, maps the real hazard zones and lets engineers optimise the plant layout cost-effectively.
The QRA workflow
An auditable, high-rigour QRA follows a systematic process:
- Isolatable section marking. System boundaries are defined on the P&IDs, based on emergency shutdown valves (ESDVs) and operating conditions.
- Hazard identification and scenario development. Credible loss-of-containment scenarios are developed, typically using Event Tree Analysis (ETA).
- Frequency analysis. Leak frequencies are calculated from equipment parts count using trusted failure databases such as OGP and HCDB.
- Consequence modelling. Jet fires, flash fires, vapour cloud explosions (VCEs), BLEVEs and toxic dispersion are simulated using tools such as PHAST and SAFETI.
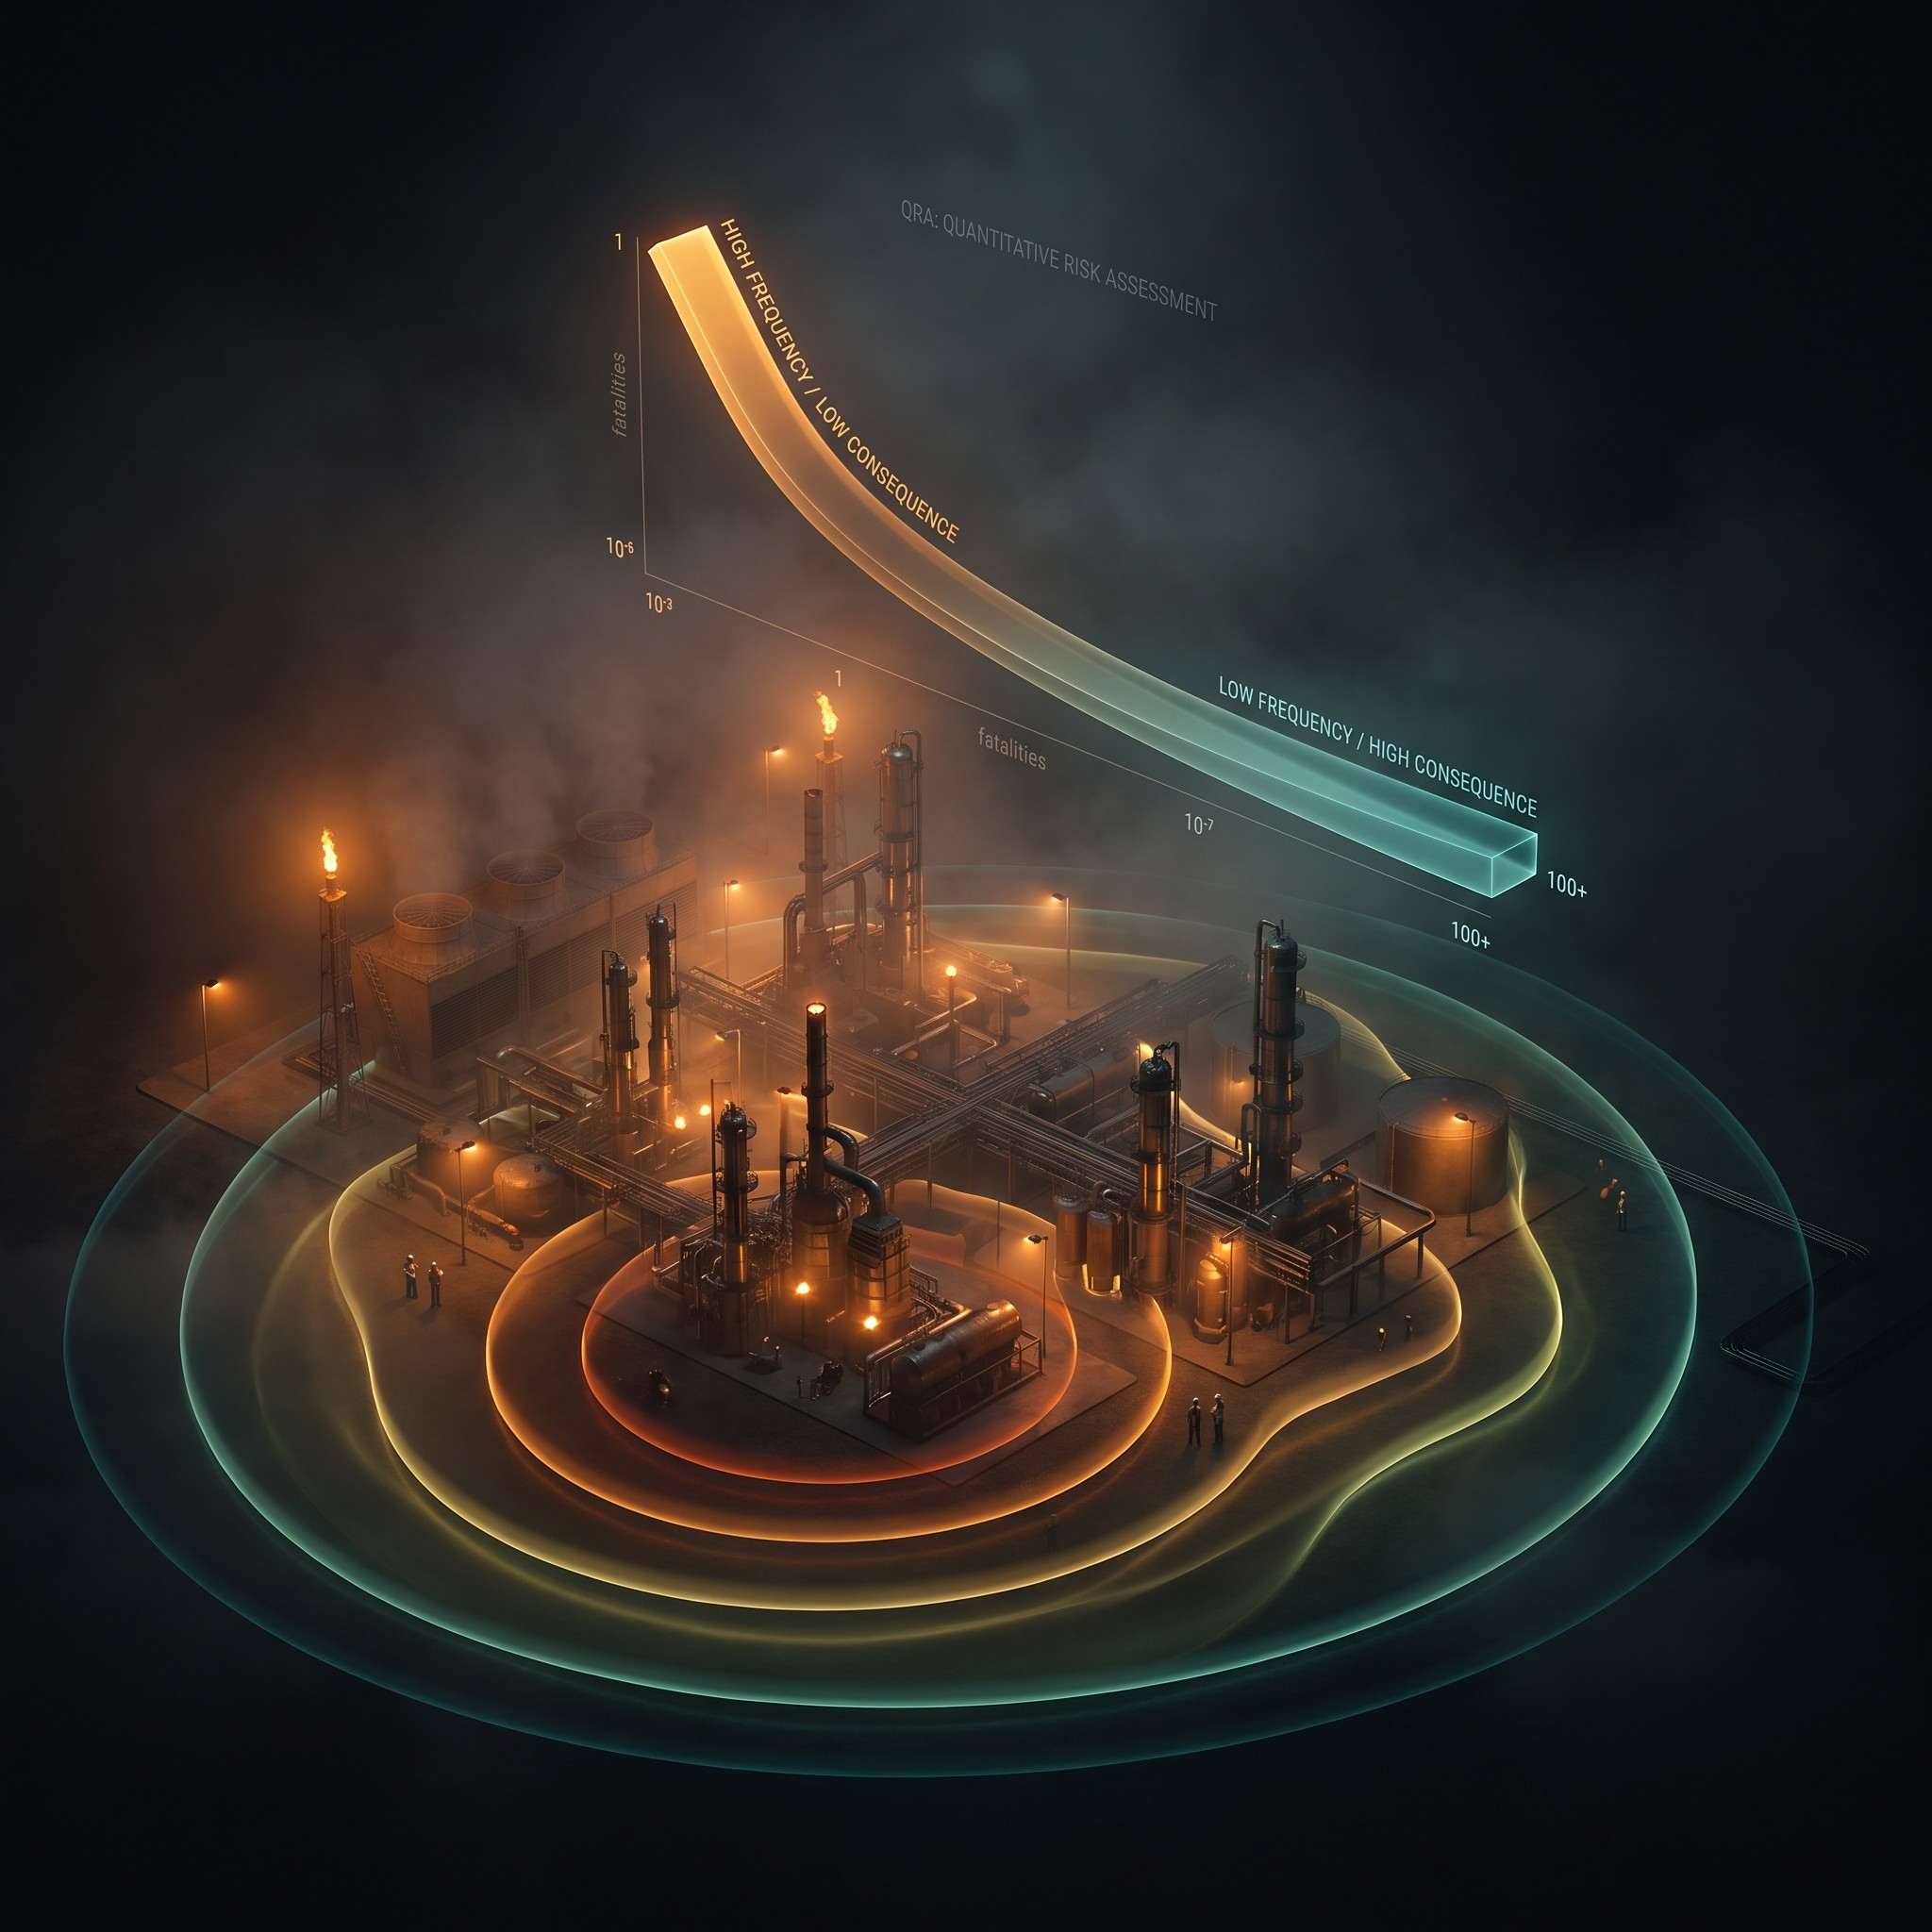
- Risk estimation and evaluation. Results are plotted as individual risk contours and FN curves and compared against tolerability criteria.
- ALARP demonstration and risk reduction measures. Where risk is not low enough, additional measures are identified and justified.
The three core risk metrics
A rigorous QRA looks at risk through three lenses:
- LSIR (Location-Specific Individual Risk). Geographical risk contours showing the risk to anyone standing in a given area.
- IRPA (Individual Risk Per Annum). Risk to specific worker groups based on their actual exposure time.
- Societal risk (FN curve). Event frequency plotted against the number of potential fatalities, describing risk to the wider community.
These metrics are compared with three tolerability bands. In the unacceptable region, risk reduction is mandatory. In the ALARP region, risk must be reduced as low as reasonably practicable, which is where cost-benefit analysis adds the most value. In the broadly acceptable region, risk is comparable to everyday background risk and needs no further action.
Turning results into practical risk reduction
When a QRA flags a high-risk zone, adjusting abstract failure frequencies does not solve the problem. The facility needs physical, consequence-reducing engineering choices, for example:
- Improving bunding and dykes to limit liquid pool fire size.
- Reducing inherent inventory to limit the scale of a release.
- Moving strong ignition sources, such as truck loading areas, away from congested process areas.
QRA is not the same as Risk-Based Inspection (RBI)
The two are often confused, but they have opposite focuses. RBI (API 581 / 571) focuses on the probability of failure, tracking corrosion, thinning and corrosion under insulation to optimise inspection intervals. QRA focuses on the consequences of failure, simulating release magnitudes to map hazard zones and optimise plant layout.
When to carry out a QRA
A QRA is a living document. It should be performed during design and major modifications, and updated across the asset lifecycle from Pre-FEED and FEED through to EPC. Regulators such as ADNOC expect QRA studies to be re-evaluated every 5 to 10 years during operation to account for modifications and ageing. Running the QRA early, at Pre-FEED or FEED, isolates the top risk contributors before the design matures and saves significant capital.
Typical inputs
P&IDs, process conditions, plant layout, population data and site meteorology.
Typical outputs
Individual and societal risk contours, a ranked list of main risk contributors, identification of Safety and Environmental Critical Elements (SECEs), an ALARP demonstration and a clear, auditable QRA report.
How EnTech can help
EnTech Engineering Solutions delivers QRA and consequence modelling (PHAST, FlareSim, SAFETI), HAZOP, HAZID and BowTie facilitation, plant layout optimisation, land-use planning studies and Safety Critical Element identification. Contact us at info@EnTech-Solution.com.